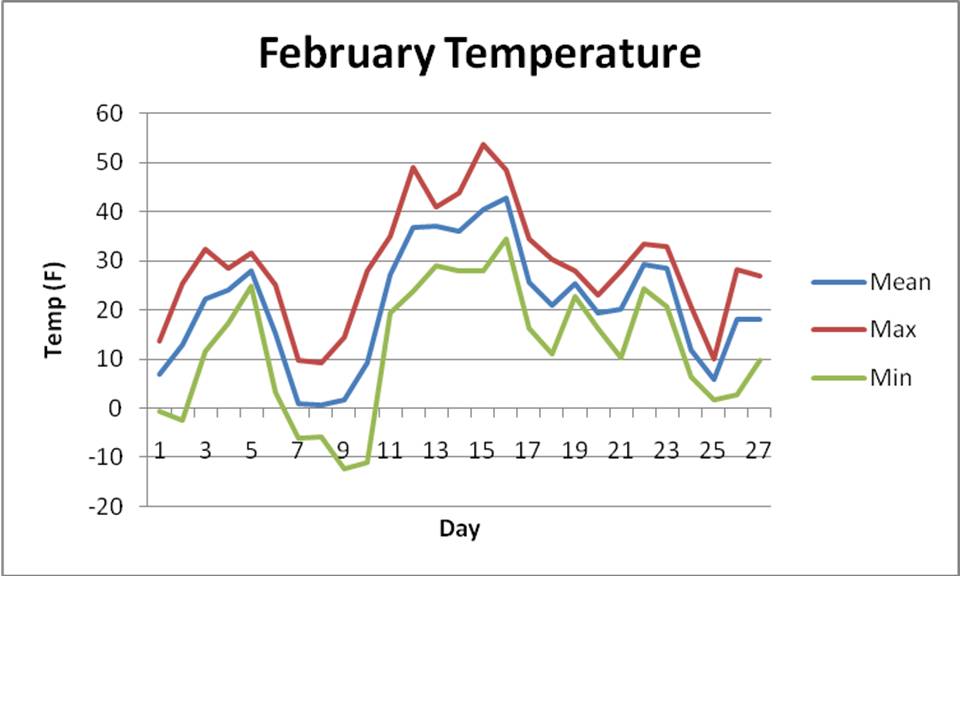
These charts show the minimum, maximum, and average temperatures of the day for each month. January had not a day above 30 degrees, and the coldest days of the new year were found in this month, with temperatures approximating -14 and -18. February was remarkably warm; one day near 50 and another surpassing it. Also two days with slightly below -10. March had not a day below 0. Just as the middle of February was warmest, so to was the middle of March, with three days above 50. April had the least fluctuations; almost all days were above 30 degrees. The warmest day approached 80. The average towards the end of the month was, however, 40 degrees.


These pie charts show the dominant wind direction for each month. Wind direction plays a big part in the weather. Wind from the North is generally cold, from the South warm; wind from the East brings storms, and wind from the West pushes them away. Our January and February had mostly westerly winds. March had west and east wind equally, and April featured east and southeast predominantly.
Finally, this graph shows the averages for daily temperature and rainfall calculated from archived data ranging from 1949 - 1995.